Fock-Darwin states of a parabolic, anisotropic (elliptical) potential in a magnetic field
In this tutorial we study the electron energy levels of a two-dimensional parabolic, anisotropic (elliptical) confinement potential that is subject to a magnetic field. Such a potential can be constructed by surrounding GaAs with an AlxGa1-xAs alloy that has a parabolic alloy profile in the (x,y) plane.
It is a good idea to get familiar with the results of a 2D parabolic and isotropic confinement beforehand: Fock-Darwin states of a 2D parabolic potential in a magnetic field
The input files used in this tutorial are the followings:
1DGaAs_ParabolicQW_infinite_4_6meV.in
1DGaAs_ParabolicQW_infinite_6_1meV.in
2DGaAs_BiParabolicEllipticQD_Austing.in/*_nnp.in
First, it is necessary to study the energy states of a 1D parabolic confinement.
1D parabolic confinement along the x direction with \(\hbar \omega_0=4.6\) meV (1D simulation)
1DGaAs_ParabolicQW_infinite_4_6meV.in
For similar results and a discussion, we refer to this tutorial: Parabolic Quantum Well (GaAs / AlAs)
1D parabolic confinement along the y direction with \(\hbar \omega_0=6.1\) meV (1D simulation)
1DGaAs_ParabolicQW_infinite_6_1meV.in
For similar results and a discussion, we refer to this tutorial: Parabolic Quantum Well (GaAs / AlAs)
2D parabolic, anisotropic (elliptical) confinement with \(\hbar \omega_x=4.6\) meV and \(\hbar \omega_y=6.1\) meV - Fock-Darwin-like spectrum (2D simulation)
2DGaAs_BiParabolicEllipticQD_Austing.in/*_nnp.in
The electron effective mass in GaAs is \(m_e^* = 0.067 m_0\). We assume this value for the effective mass in the whole region (i.e. also inside the AlGaAs alloy).
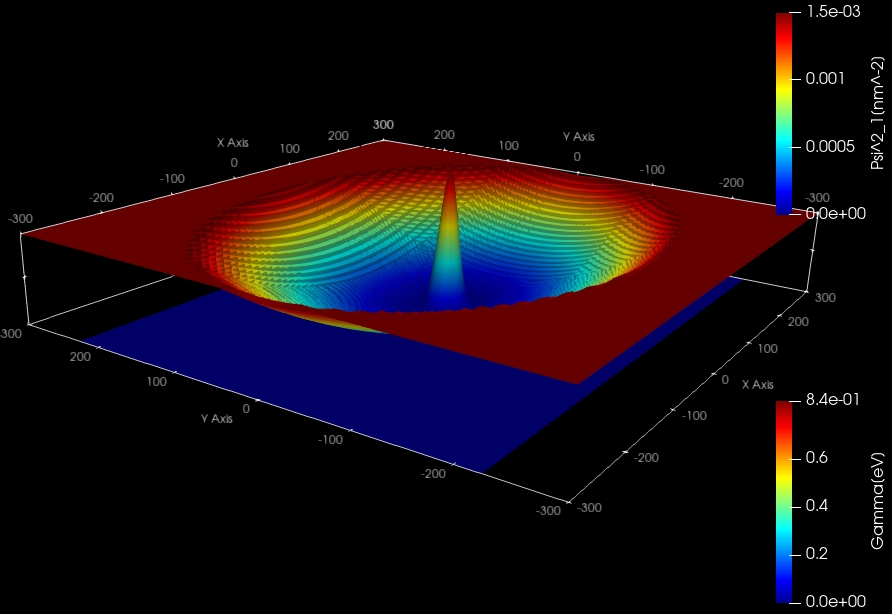
Ground state wave function (:math:`psi^2`)
The following figure shows the parabolic, anisotropic (elliptical) conduction band edge confinement potential, as well as the ground state wave function (\(\psi^2\)) at \(B = 0\) T calculated in nextnano++. In the middle of the sample the conduction band edge is at 0 eV and at the boundary region the conduction band edge has the value 0.84 eV. The radii of the ellipse are 300 nm along the x axis and 226 nm along the y axis. The parabolic confinement along the x direction is: \(\hbar\omega_x = 4.6\) meV
The parabolic confinement along the y direction is: \(\hbar\omega_y = 6.1\) meV
Thus the ellipticity is roughly 4/3.
Fock-Darwin spectrum
At zero magnetic field, the eigenvalues for such a system are given by:
where \(n\) is a radial quantum number, \(l\) an angular momentum quantum number, \(\omega_x\) and \(\omega_y\) oscillator frequencies.
For more details, see A.V. Madhav, T. Chakraborty, Physical Review B 49, 8163 (1994).
The eigenvalue spectrum of a 2D parabolic and isotropic potential shows a shell-like structure: Energy levels of an “artificial atom” - 2D harmonic potential . For the anisotropic elliptical potential, this degeneracy at \(B = 0\) T is lifted.
The following figure shows the calculated Fock-Darwin-like spectrum, i.e. the eigenstates as a function of magnetic field magnitude. This is the result of nextnano³ and each of these states is two-fold spin-degenerate. However, a magnetic field lifts this degeneracy (Zeeman splitting) but this effect is not taking into account in this tutorial.
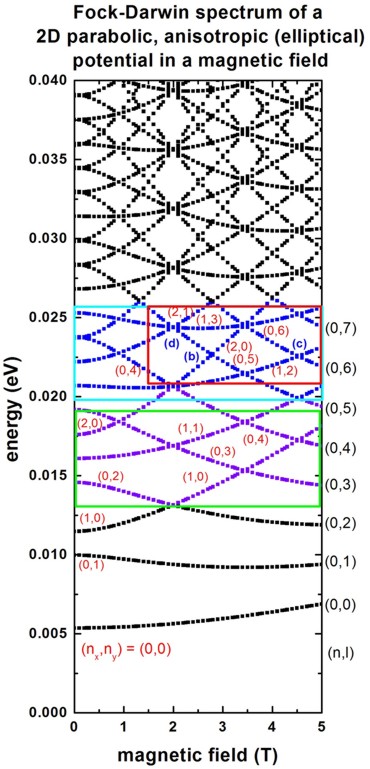
Such a spectrum can be related to experimental transport measurements which give insight into the single-particle energy spectrum of a quantum dot.
The rectangles in the above figure are related to the figures of the following publications:
cyan rectangle: Fig.2 of
green rectangle and red rectangle: Fig.2(b) and Fig.3(a) of
(Comments on red rectangle: In Fig. 3(a) of the publication by Austing et al., the ground state energy has been subtracted from the excited states. Thus the slope of the energy spectrum look slightly different.)
It is interesting to note that there are exact crossings in the calculated spectrum whereas the experiment reveals anti-crossings. In the first reference, this difference on crossings is regarded as a crue to investigate the deviations between the confining potential of realistic dots used in the experiment and the idealistic parabolic potential assumed in the calculation.
Last update: nn/nn/nnnn