Template
This web page describes the template feature of nextnanomat.
In the Template tab you can overview all variables which are defined in the input file. You can sweep a chosen variable by a list of values or a range of values. Additionally, there is the option to compare the sweep results by the post-processing feature: It collects specified data from sweep files and stores them in a separate file, so that e.g. interband transition energy can be visualized as a function of well width.
An example how the template can be used to sweep over a variable, e.g. the quantum well width, is shown in this Exciton Binding Energy in an Infinite Quantum Well.
Variable definition in input file (required)
<Variable> = <Value> <Comment>
with the following syntax definition:
- Variable (required)
A
<Variable>starts with a$or%sign (%should be preferred), can contain the charactersA-Z,a-z,0-9and the underscore (_). It is case-sensitive. See documentation of Input Syntax in respective tools for further reference.- Value (required)
Any string after the
=sign without#and!characters is considered as<Value>. It is used as default value for the Template and Template (Beta) user interface.- Comment (optional)
Starts with a
#or!sign and is used as a description of the variable in the Template user interface. The comment may also include the following keywords (including brackets):
# (DoNotShowInUserInterface)This variable is not shown to the user in the Template user interface.
# (DisplayUnit:<Unit>)A string to show the unit for the variable (optional)
# (ListOfValues:<default>)Default values for
List of valuesinput control
# (RangeOfValues:From=1,To=10,Step=1)Default values for
Range of valuesinput control
# (HighlightInUserInterface)Highlights variable in Template user interface in yellow
Note
Every line that starts with a $ (not nn3) or % (after stripping leading spaces) and includes a = is considered a variable definition.
Example
$well_width = 6 # Variable for quantum well width. (DisplayUnit:<nm>) (RangeOfValues:From=6,To=18,Step=2) (HighlightInUserInterface)
Sweep over a variable + optional post-processing
If an input file includes at least one variable definition, it is possible to automatically sweep over it.
The Template Tab of nextnanomat can be seen in Figure 1.1.4, already pre-filled for a variable sweep.
To reproduce, please follow these steps:
The input file has to be chosen as the template file. Thus all correct variable definitions are loaded into the list.
Choose a sweeping variable and complete the required fields, e.g.
List of valuesforQW_Separation.The input files can be created by clicking the
Create input filesbutton.They will be added to the batch list. To start the simulations you have to switch to the
Simulation-tab, see Figure 1.1.5.
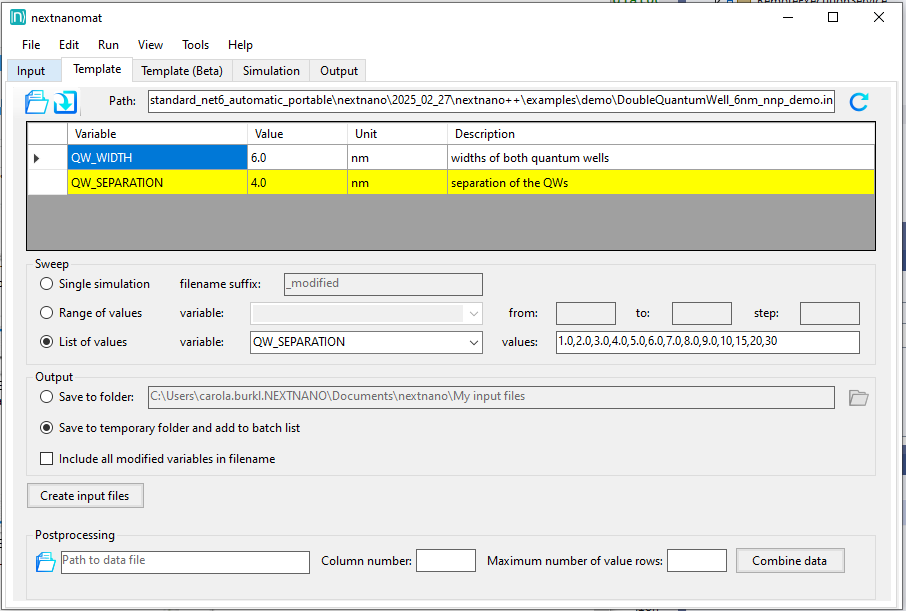
Figure 1.1.4 Template tab of nextnanomat with double quantum well input file loaded.
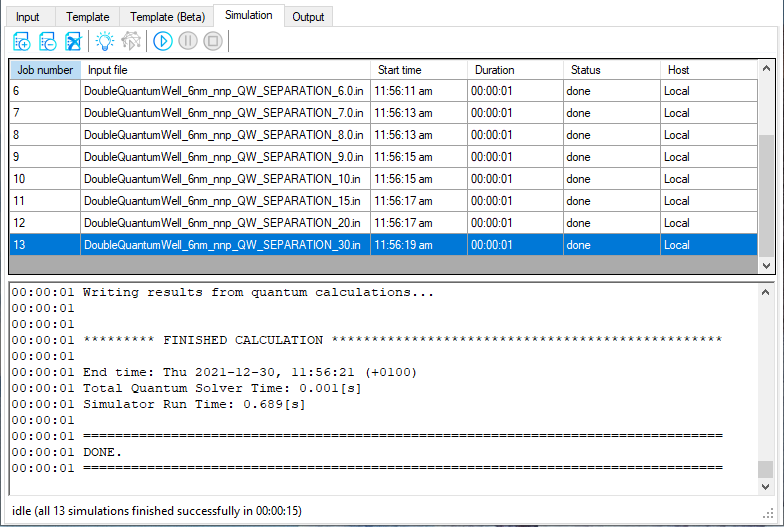
Figure 1.1.5 Batchlist of successfully simulated template sweep.
The sweep of a variable is now completed.
When the simulations are done, you have the possibility to use the post-processing feature. Its input fields are also located in the Template tab and can be seen in Figure 1.1.6. To use post-processing,
Choose the output file (*.dat) and the column number of the variable you want to compare, e.g. the file energy_spectrum_quantum_region_Gamma.dat displayed in Figure 1.1.7 and Figure 1.1.8
Additionally, state the maximum number of values (rows) which will be compared. (It is not allowed to exceed the existing number of rows.)
Now push the button
Combine dataandVisualize your results in the
Output-tab, see Figure 1.1.9.
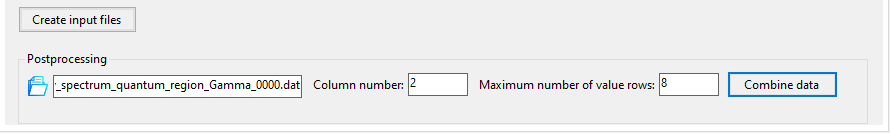
Figure 1.1.6 Additional fields to post-process a variable sweep.
For the steps 5 and 6 it is necessary to check the data structure of the simulation result you are interested in.
Go to Output tab, select the data file and toggle Text view.
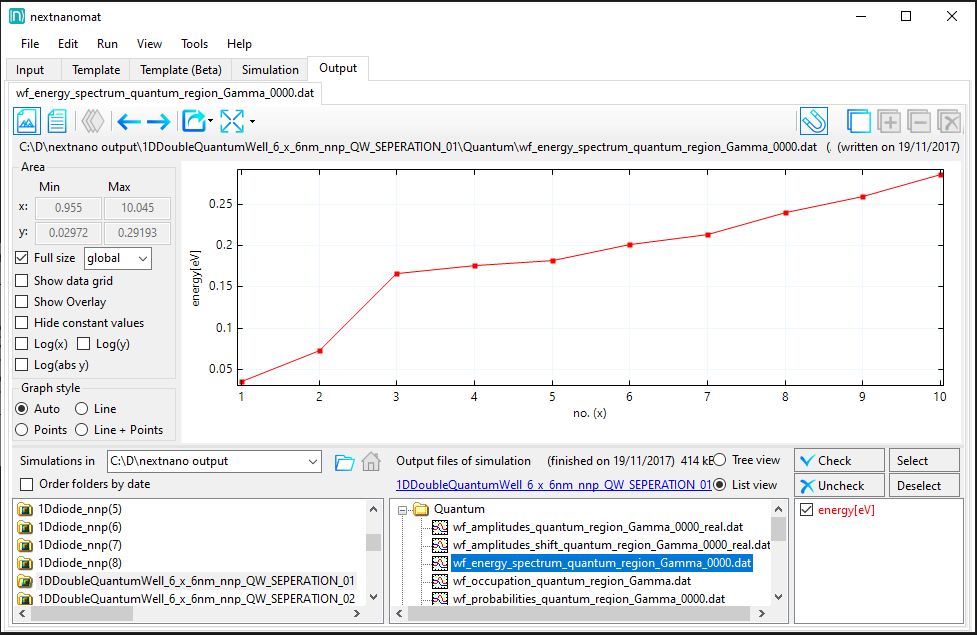
Figure 1.1.7 Energy eigenvalues of the first four electron states. Visualized as curves.
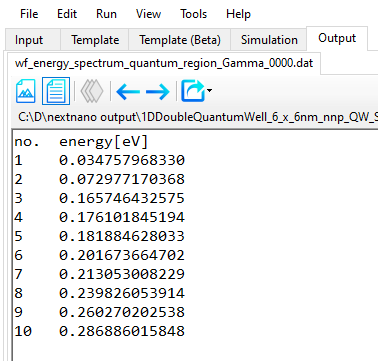
Figure 1.1.8 Text view of same output file.
The result plots the chosen data in relation of the sweeping variable, see Figure 1.1.9.
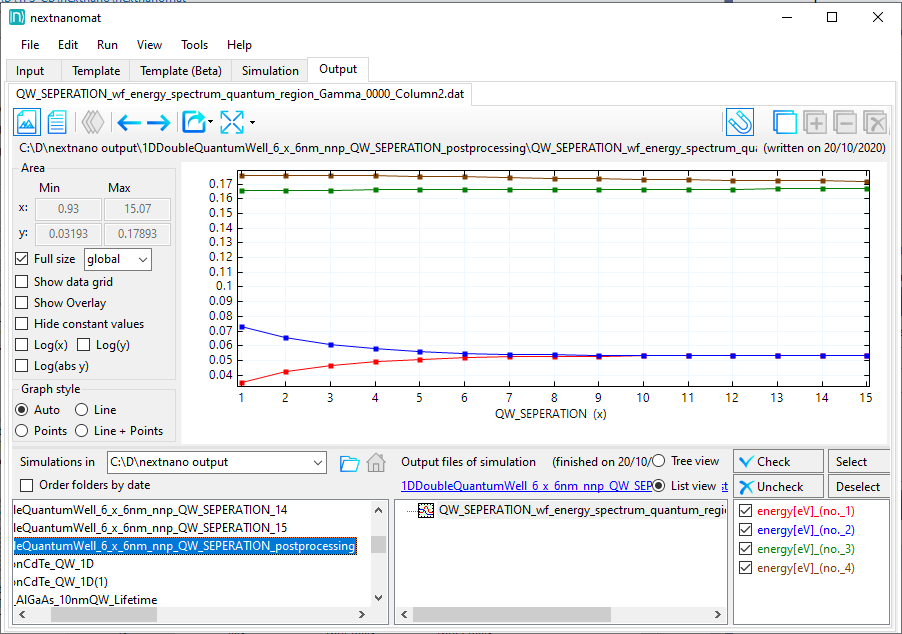
Figure 1.1.9 Result of post-processing. Electron energy eigenvalue in relation of quantum well separation.
Post-processing of existing sweep
If you have already done some sweeps in the past, you can also use the post-processing feature of nextnanomat retroactively. Note, additional to the post-processing steps described above, you need to load the correct template file and select and fill in the same variable values which have been used for the sweep.