Cascade solar cell (Tandem solar cell)
- Input Files:
1DCascadeSolarCell_nnp.in / *nn3.in
In this tutorial, we solve the Poisson equation in an AlGaAs/InGaAs monolithic cascade solar cell (tandem solar cell).
The layout is based on US patent 4179702 (1979): Cascade solar cells by Michael F. Lamorte.
See also the following publication for more details
Input files used in this tutorial are followings:
Outputs
Band profile
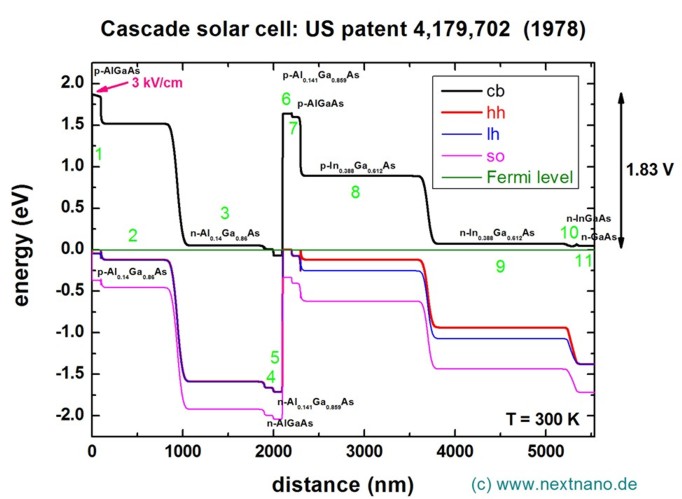
The following figure shows the conduction band edge and the valence band edges (heavy hole, light hole and split-off hole) of this solar cell at zero bias. The built-in potential has been calculated to be 1.83 V.
On the left side (region 1), a graded p-type AlGaAs layer has been used to generate an electric field of 3 kV / cm (= 30 meV / 100 nm). We assumed that all materials are strained with respect to the GaAs substrate, thus the degeneracy of heavy and light hole valence band edges is lifted, especially inside the InGaAs regions.
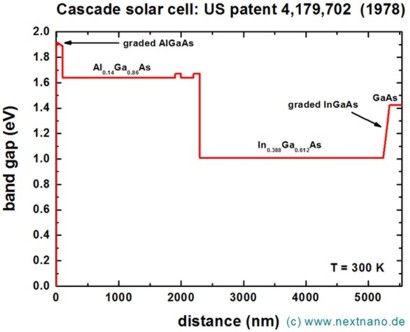
Band gap
The band gap as a function of distance is shown in the following figure. This data can be found in these files. For nextnano++, we need to add classical{ output_bandgap{} } in the sample file.
bias_00000/bandgap.dat (nextnano++)
band_structure/BandGap1D.dat (nextnano³)
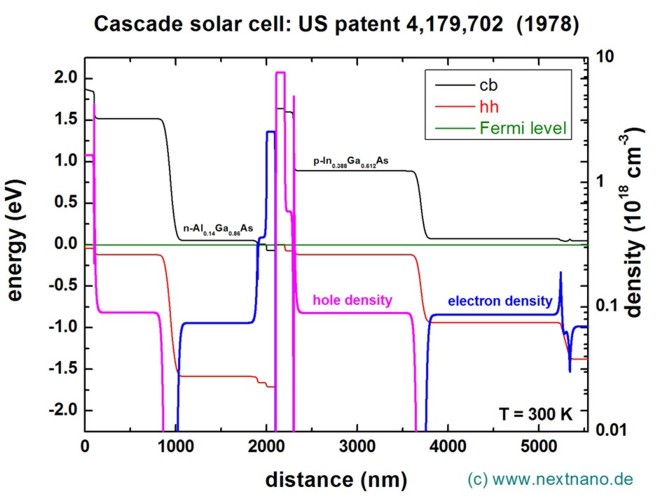
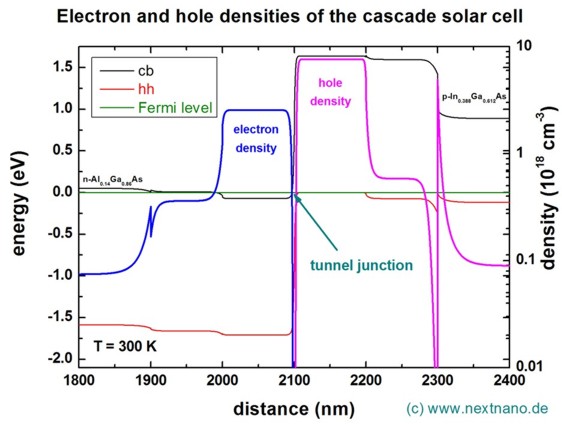
Electron and hole densities
Here, the electron and hole densities are plotted. This data can be found in these files.
bias_00000/density_electron.dat, bias_00000/dentity_hole.dat (nextnano++)
densities/density_el.dat, densities/density_hl.dat (nextnano³)
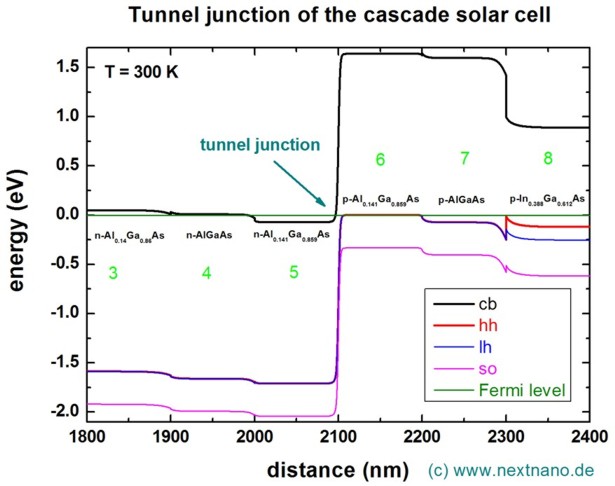
Tunnel junction
The area around the tunnel junction which is in the middle of the device at ~2100 nm is shown in this plot:
The electron and hole densities in the vicinity of the tunnel junction are shown in this graph. Note that the density has been calculated classically (without solving the Schrödinger equation, i.e. without quantum mechanics).
What we can do on a solar cell using nextnano
We have the demonstration of the simulation for GaAs solar cell using nextnano GmbH here: GaAs Solar Cell.
As we can see in this demonstration, we can calculate the following characteristics by solving the Poisson equation and current equation self-consistently.
Current-Voltage characteristics
The dark current can also be calculated.
Solar efficiency
We can also see the effect of optical concentration quantitatively.
The data we need to prepare independently for this calculation is:
spectral irradiance (solar spectrum)
reflectivity at the front surface
absorption spectrum
Both nextnano++ and nextnano³ can calculate the generation rate \(G(x)\) now. We can also import the data of \(G(x)\) directly instead of 2 and 3 above.
The links for all the used data is also specified in this tutorial: GaAs Solar Cell.
Last update: 10/06/2024