How to export 2D or 3D plot files with Gnuplot
In 2D you have some additional options for your gnuplot file compared to the 1D export, displayed in Figure 1.5.20.
The plot can be displayed as a color map, analog to the implementation of nextnano,
or as a surface plot, which is a pseudo three-dimensional plot (Figure 1.5.21).
Title and labels are optional and if they are not specified
they will be taken directly from the file (if provided).
If remember settings is checked, the next time the panel will be pre-filled with these settings.
If you always use the same settings and do not want this dialog to be displayed each time,
you can chose the Create Gnuplot file - last used (*.plt) option in the context menu.
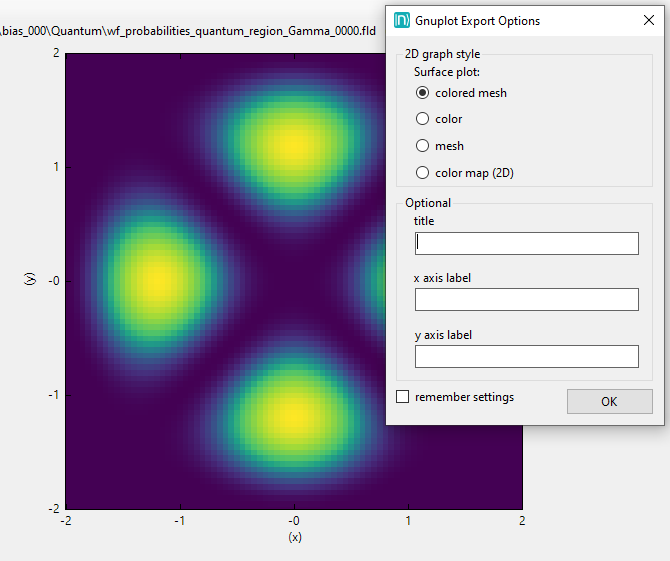
Figure 1.5.20 Additional options for more-dimensional Gnuplot export.
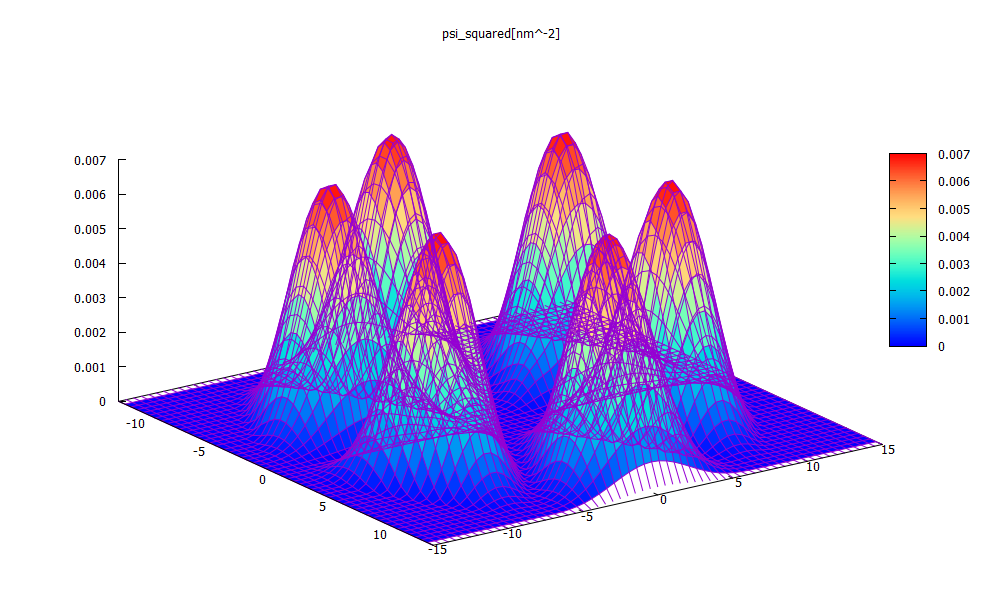
Figure 1.5.21 Example of Gnuplot surface plot option colored mesh
(Probability density of the 10th wave function in a hexagonal structure.)
Gnuplots are interactive, see Figure 1.5.22, which makes them suitable to create animations e.g. for presentations. Furthermore they can be saved as vector graphics. To understand the dependency between plot files and their raw data files, please refer to the next section.
Figure 1.5.22 Interactive surface plot.