Gnuplot export
Gnuplot can be used to export and save nextnano simulation results, see documentation: Gnuplot export.
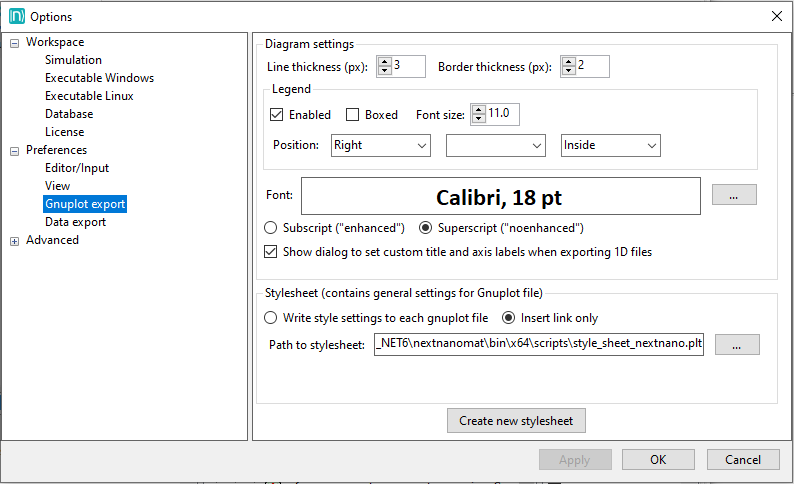
Figure 1.2.7 Settings for Gnuplot export and graph style.
The default settings for the Gnuplot export can be adjusted in this options tab.
For example, you can specify the line thickness, position of the legend (called key in Gnuplot) and many more.
If you want to use a stylesheet to incorporate advanced settings - like the specification of color sequence or line styles, you can either link an existing one or create one from the default nextnano Gnuplot settings. If you create a new one from the nextnano settings, the path to the stylesheet will be automatically updated. It is recommended to open that file with a texteditor to get familiar with the syntax. You can then easily adapt it to your needs.
Advantages of using a stylesheet
Central, single file with your settings for plotting Gnuplot plots
Use of links and variables (linking to the stylesheet) within the plot files
Adjust settings at one place and automatically get the changes for all your plots
Great for publications to achieve uniform style with possibility for last minute changes
To use a central stylesheet, select the checkbox Insert link only.
Note
You can create multiple stylesheets for different purposes. Set the path within Gnuplot settings to the one you want to use for new plots generated by nextnanomat.