Intersubband absorption of an infinite quantum well
- Input files for nextnano³:
1D_IntersubbandAbsorption_InfiniteWell_GaAs_Chuang_sg_nn3.in
1D_IntersubbandAbsorption_InfiniteWell_GaAs_Chuang_kp_nn3.in
- Input files for nextnano++:
1D_IntersubbandAbsorption_InfiniteWell_GaAs_Chuang_sg_nnp.in
1D_IntersubbandAbsorption_InfiniteWell_GaAs_Chuang_Gamma_nnp.in
1D_IntersubbandAbsorption_InfiniteWell_GaAs_Chuang_kp_nnp.in
This tutorial presents calculation of intersubband absorption spectrum of a GaAs quantum well with infinite barriers.
Input files for both the nextnano++ and nextnano³ software are available.
The following input file was used:
1D_IntersubbandAbsorption_InfiniteWell_GaAs_Chuang_sg_nn3.in(single-band effective mass approximation)
This tutorial aims to reproduce the example discussed on p. 376f of Section 9.6.2 Intersubband Absorption Spectrum of [ChuangOpto1995].
Structure
Property |
Symbol |
unit |
nextnano |
||
|---|---|---|---|---|---|
quantum well width |
L |
nm |
10.0 |
10.0 |
|
barrier height |
E b |
eV |
infinite quantum well model |
1000 |
|
effective electron mass |
me |
m0 |
0.0665 |
0.0665 |
|
refractive index |
nr |
3.3 |
3.3 |
||
doping concentation (n-type) |
ND |
cm-3 |
1 \(\cdot\) 1018 |
1 \(\cdot\) 1018 |
|
linewidth (FWHM) |
\(\Gamma\) |
meV |
30 |
30 |
|
temperature |
T |
K |
300 |
300 |
|
[ChuangOpto1995] models the infinite quantum well using the analytical solution while we are using a numerical model with a barrier height of 1000 eV.
Results
[ChuangOpto1995] uses the analytical infinite quantum well model and calculates the energy levels, and the intersubband dipole moment exactly. Our calculated transition energies differ by 3 meV which is acceptable as we use a finite grid spacing of 0.05 nm. Our calculated dipole moment is also reasonable. More difficult are the densities. In our calculation we solve the Schrödinger-Poisson equation self-consistently. For that reason, the quantum well bottom is not entirely flat but slightly bent. At T = 300 K, the second subband shows a small density which is larger than in the model of [ChuangOpto1995]. The difference in subband densities leads to a slight deviation for the peak of the absorption spectrum because the occupation of the second level N2 reduces absorption. Nevertheless, the agreement is reasonable.
Property |
Symbol |
unit |
nextnano |
|
|---|---|---|---|---|
energy level |
E1 |
meV |
56.5 (exact) |
|
energy level |
E2 |
meV |
226 (exact) |
|
transition energy |
E21 |
meV |
169.5 (exact) |
166.5 |
dipole moment |
x21 |
nm |
-1.8 (exact) |
-1.82 |
EF - E1 |
eV |
78 |
28.2 |
|
subband density |
N1 |
cm-2 |
7.19 \(\cdot\) 1011 |
9.92 \(\cdot\) 1011 |
subband density |
N2 |
cm-2 |
3 \(\cdot\) 109 |
|
peak in absorption |
\(\alpha\)peak |
cm-1 |
1.015 \(\cdot\) 104 |
0.986 \(\cdot\) 104 |
The following figures show the
lowest eigenstates (probability densities) of the infinite quantum well
absorption spectra \(\alpha(\omega)\) in units of cm-1
position dependent absorption spectra \(\alpha(\omega ,x)\) in units of cm-1
The peak in the absorption spectra occurs at the transition energy E21.
Then we perform two parameter sweeps:
We vary the quantum well width (Variable:
$QuantumWellWidth).We vary the doping concentration (Variable:
$DopingConcentration).
Results and explanations for the sweeps can be found further below.
— Begin —
Automatic documentation: Running simulations, generating figures and reStructured Text (*.rst) using nextnanopy
The following documentation and figures were generated automatically using nextnanopy.
The following Python script was used: intersubband_InfiniteQW_nextnano3.py
The following figures have been generated using the nextnano³ software. Self-consistent Schrödinger-Poisson calculations have been performed for an infinite quantum well.
A single-band effective mass approach has been used, i.e. not \(\mathbf{k} \cdot \mathbf{p}\).
The absorption spectra have been calculated assuming a parabolic energy dispersion \(E(k)\).
Infinite Quantum Well (QuantumWellWidth = 10 nm)
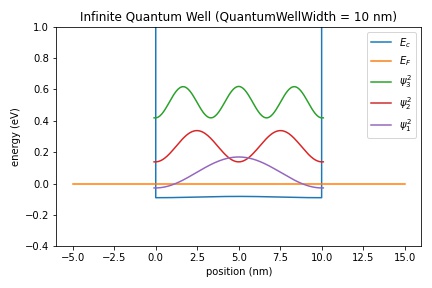
Figure 2.5.12.28 Conduction band edge, Fermi level and confined electron states of an infinite quantum well (QuantumWellWidth = 10 nm)
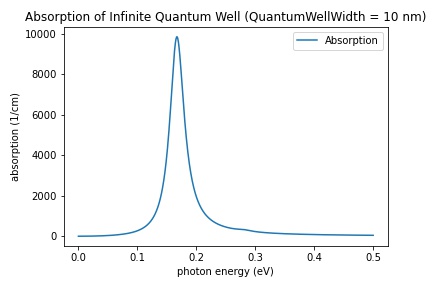
Figure 2.5.12.29 Calculated absorption spectra \(\alpha(E)\) of an infinite quantum well (QuantumWellWidth = 10 nm)
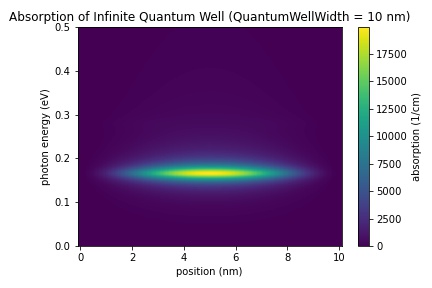
Figure 2.5.12.30 Calculated spatially resolved absorption spectrum \(\alpha(x,E)\) of an infinite quantum well (QuantumWellWidth = 10 nm)
Infinite Quantum Well (QuantumWellWidth = 13 nm)
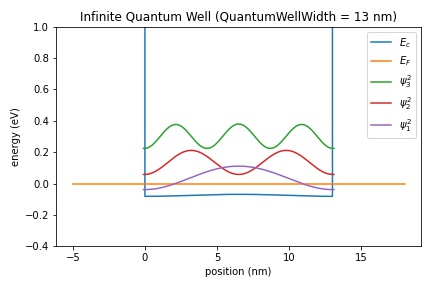
Figure 2.5.12.31 Conduction band edge, Fermi level and confined electron states of an infinite quantum well (QuantumWellWidth = 13 nm)
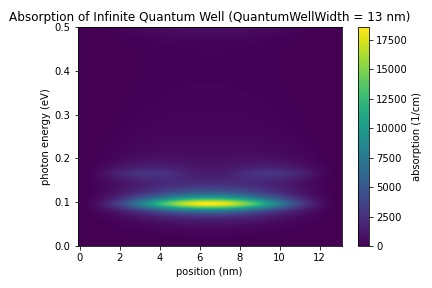
Figure 2.5.12.32 Calculated spatially resolved absorption spectrum \(\alpha(x,E)\) of an infinite quantum well (QuantumWellWidth = 13 nm)
Infinite Quantum Well (QuantumWellWidth = 16 nm)
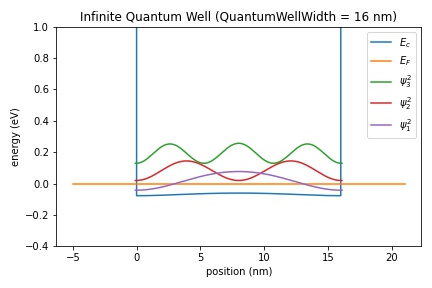
Figure 2.5.12.33 Conduction band edge, Fermi level and confined electron states of an infinite quantum well (QuantumWellWidth = 16 nm)
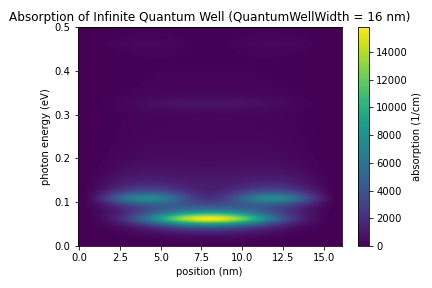
Figure 2.5.12.34 Calculated spatially resolved absorption spectrum \(\alpha(x,E)\) of an infinite quantum well (QuantumWellWidth = 16 nm)
Infinite Quantum Well (QuantumWellWidth = 19 nm)
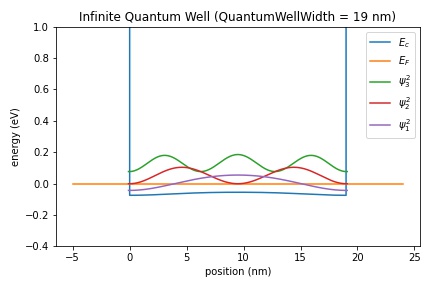
Figure 2.5.12.35 Conduction band edge, Fermi level and confined electron states of an infinite quantum well (QuantumWellWidth = 19 nm)
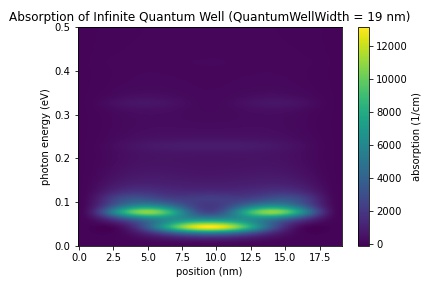
Figure 2.5.12.36 Calculated spatially resolved absorption spectrum \(\alpha(x,E)\) of an infinite quantum well (QuantumWellWidth = 19 nm)
Parameter sweep: Well width
Figure 2.5.12.37 shows the absorption spectra for different quantum well widths (Variable: $QuantumWellWidth). The larger the well, the closer the energy level spacings. Therefore the peak occurs at smaller energies. The larger wells show absorption also for transitions other than E21.
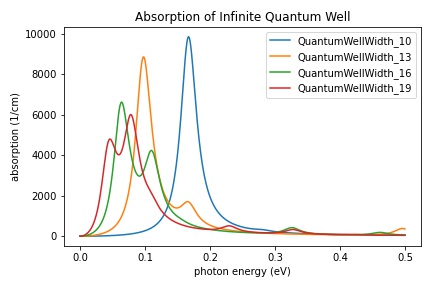
Figure 2.5.12.37 Calculated absorption spectra \(\alpha(E)\) of an infinite quantum well for different well widths
Parameter sweep: Doping concentration
Figure 2.5.12.38 shows the absorption spectra for different doping concentrations (Variable: $DopingConcentration). The peak absorption coefficient increases with the doping concentration ND.
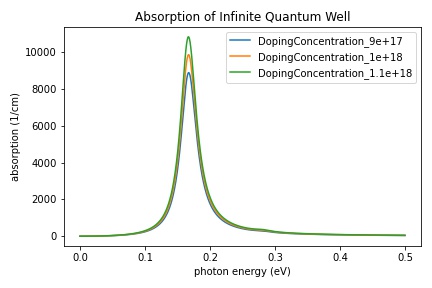
Figure 2.5.12.38 Calculated absorption spectra \(\alpha(E)\) of an infinite quantum well for different doping concentrations
Last update: nn/nn/nnnn